Back to Selection     Print       Date : 30 Sep 2026
Fund Summary
MIRAE ASSET NIFTY METAL ETF
[Equity: Index]  
 
Fund Details
Fund Type Growth Launch Date 03-Oct-24
Corpus(Cr.) 542.00 Latest NAV 11.9846 As on 29-10-2026
Equity(%) 100.01 52 Week High 13.8067
Debt(%) -0.01 52 Week Low 10.065
Others(%) 0.00 Exit Load 0
Minimum Investment - Availability
Entry Load Nil Expense Ratio(%) 0.00
Scheme Benchmark NIFTY Metal TRI Broader Benchmark NSE - Nifty 50 TRI
Fund Manager Ritesh Patel
 
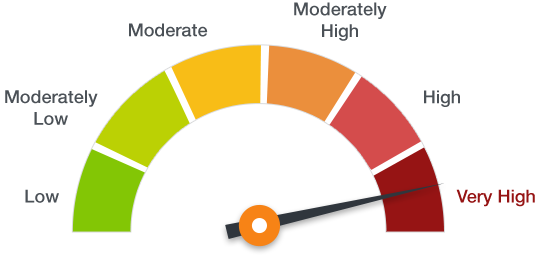
Riskometer
Investors understand that their principal will be at Very High risk
 
Scheme Objective
The scheme seeks to generate returns, before expenses, that are commensurate with the performance of the Nifty Metal Total Return Index, subject to tracking error. The Scheme does not guarantee or assure any returns.

Portfolio Classification
 
Asset Mix
 
Concentration Analysis
Top 5 Holdings 65.44%
Top 10 Holdings 86.41%
Top 25 Holdings 100.00%
 
Sector Analysis
Sector/Ratings Net Asset(%)
Ferrous Metals 41.33
Metals 37.12
Trading 11.14
Minerals & Mining 5.91
Industrial Products 4.51
Cash -0.01


Portfolio Metrics
PB Ratio 2.53
PE Ratio 16.05
 
Top 25 Holdings
Holdings Net Asset(%)
TATA STEEL LIMITED 17.30
Hindalco Industries Ltd. 15.43
JSW Steel Limited 13.65
Adani Enterprises Ltd. 11.14
Vedanta Aluminium Metal Limited 7.92
Vedanta Ltd. 5.16
JINDAL STEEL LIMITED 4.76
APL Apollo Tubes Limited 4.51
National Aluminium Co. Ltd. 3.46
Hindustan Zinc Ltd. 3.08
NMDC Ltd 2.99
Steel Authority of India Ltd. 2.97
Lloyds Metals and Energy Limited 2.92
Jindal Stainless Limited 2.65
Hindustan Copper Ltd. 2.07
TREPS 0.13
Net Current Assets -0.02
Net Receivables / (Payables) -0.12

Performance Analysis
 
Short Terms Returns
1 Month 3 Month 6 Month 1 Year
-8.38% -6.47% -9.14% 10.71%
 
Broader Market Benchmark [NSE - Nifty 50 TRI]
1.01% -5.23% -4.33% -11.05%
 
Scheme Benchmark [NSE - Nifty Metal]
-8.54% -6.61% -9.63% 9.94%
 
Long term Returns
2 Year 3 Year 5 Year 10 Year
13.33% 0.00% 0.00% 0.00%
 
 
-2.07% 7.60% 6.59% 11.58%
 
 
12.64% 22.38% 16.31% 16.02%
 
Cumulative Performance of Last 5 Years
 
Calendar Year Returns

Risk Analysis
 
Absolute Metrics (Single Computation - last 3 years)
Scheme Name Standard Deviation Sharpe Ratio Downside Deviation Downside Probability Sortino Ratio
MIRAE ASSET NIFTY METAL ETF 0.00% 0.0000 0.0000% 0.0000 0.0000
 
Benchmark Relative Metrics (Single Computation - last 3 years)
Scheme Name Alpha Beta Treynor Ratio Tracking Error Information Ratio
MIRAE ASSET NIFTY METAL ETF 0.0000% 0.0000 0.0000 0.0000 0.0000
 
Back to Selection