Back to Selection     Print       Date : 30 Sep 2026
Fund Summary
Mirae Asset Global Electric & Autonomous Vehicles Equity Passive FOF Reg (G)
[Equity: Global]  
 
Fund Details
Fund Type Growth Launch Date 07-Sep-22
Corpus(Cr.) 66.00 Latest NAV 14.001 As on 29-10-2026
Equity(%) 0.00 52 Week High 19.714
Debt(%) 0.27 52 Week Low 12.402
Others(%) 0.00 Exit Load 1% for redemption within 365 days
Minimum Investment - Availability
Entry Load Nil Expense Ratio(%) 0.00
Scheme Benchmark Solactive Autonomous & Electric Vehicles TRI Broader Benchmark NSE - Nifty 50 TRI
Fund Manager Siddharth Srivastava
 
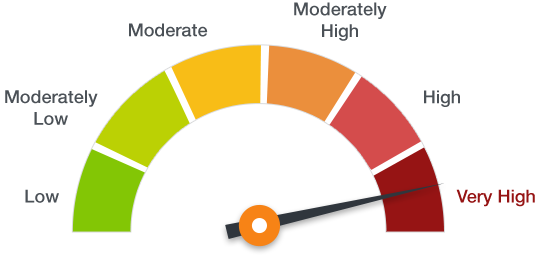
Riskometer
Investors understand that their principal will be at Very High risk
 
Scheme Objective
The scheme seeks to provide long-term capital appreciation from a portfolio investing in units of overseas equity ETFs which are based on companies involved in development of Electric & Autonomous Vehicles and related technology, components and materials.

Portfolio Classification
 
Asset Mix
 
Concentration Analysis
Top 5 Holdings 100.20%
Top 10 Holdings 100.00%
Top 25 Holdings 100.00%
 
Sector Analysis
Sector/Ratings Net Asset(%)
Global Equity 99.73
Cash 0.27


Portfolio Metrics
PB Ratio 0.00
PE Ratio 0.00
 
Top 25 Holdings
Holdings Net Asset(%)
Global X Autonomous & Electric Vehicles UCITS ETF 75.48
Global X Lithium & Battery Tech UCITS ETF 15.21
Global X China Electric Vehicle and Battery ETF 9.04
TREPS 0.48
Net Current Assets -0.01
Net Receivables / (Payables) -0.20

Performance Analysis
 
Short Terms Returns
1 Month 3 Month 6 Month 1 Year
-8.78% -7.84% -20.29% 2.00%
 
Broader Market Benchmark [NSE - Nifty 50 TRI]
1.01% -5.23% -4.33% -11.05%
 
Scheme Benchmark [Solactive Autonomous & Electric Vehicles Index (TRI)]
-8.43% -5.42% -15.81% 0.10%
 
Long term Returns
2 Year 3 Year 5 Year 10 Year
20.24% 16.72% 0.00% 0.00%
 
 
-2.07% 7.60% 6.59% 11.58%
 
 
15.77% 15.12% 1.76% 0.00%
 
Cumulative Performance of Last 5 Years
 
Calendar Year Returns

Risk Analysis
 
Absolute Metrics (Single Computation - last 3 years)
Scheme Name Standard Deviation Sharpe Ratio Downside Deviation Downside Probability Sortino Ratio
Mirae Asset Global Electric & Autonomous Vehicles Equity Passive FOF Reg (G) 26.31% 0.0000 0.0000% 0.0000 0.0000
 
Benchmark Relative Metrics (Single Computation - last 3 years)
Scheme Name Alpha Beta Treynor Ratio Tracking Error Information Ratio
Mirae Asset Global Electric & Autonomous Vehicles Equity Passive FOF Reg (G) 0.0000% 0.0000 0.0000 0.0000 0.0000
 
Back to Selection