Back to Selection     Print       Date : 30 Sep 2026
Fund Summary
PGIM India Emerging Markets Equity FoF (G)
[Equity: Global]  
 
Fund Details
Fund Type Growth Launch Date 11-Sep-07
Corpus(Cr.) 1415.00 Latest NAV 20.45 As on 29-10-2026
Equity(%) 0.00 52 Week High 25.51
Debt(%) 3.36 52 Week Low 17.11
Others(%) 0.00 Exit Load 0.5% for redemption within 90 days
Minimum Investment - Availability
Entry Load Nil Expense Ratio(%) 0.00
Scheme Benchmark MSCI Emerging Markets TRI Broader Benchmark NSE - Nifty 50 TRI
Fund Manager Anandha Padmanabhan Anjeneyan
 
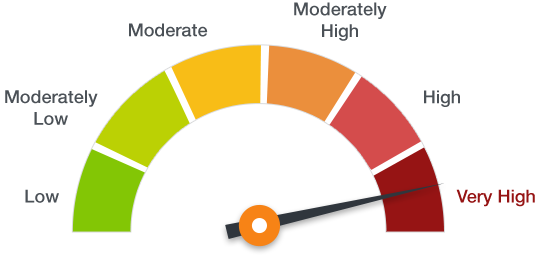
Riskometer
Investors understand that their principal will be at Very High risk
 
Scheme Objective
The fund invests in equities of issuers with headquarter in a member state of the European economic and monetary union(EMU). The fund management tries to identify current & future market leaders while putting special emphasis on the companies structural growth and earnings momentum characteristics. Although the fund the primarily invests in large caps; small & mid caps can make up 30% of the fund assets.

Portfolio Classification
 
Asset Mix
 
Concentration Analysis
Top 5 Holdings 100.00%
Top 10 Holdings 100.00%
Top 25 Holdings 100.00%
 
Sector Analysis
Sector/Ratings Net Asset(%)
Global Equity 96.64
Cash 3.36


Portfolio Metrics
PB Ratio 0.00
PE Ratio 0.00
 
Top 25 Holdings
Holdings Net Asset(%)
PGIM Jennison Emerging Markets Equity Fund 96.64
Clearing Corporation of India Ltd. 3.31
Net Receivables / (Payables) 0.05

Performance Analysis
 
Short Terms Returns
1 Month 3 Month 6 Month 1 Year
-10.74% 2.82% -13.20% 10.78%
 
Broader Market Benchmark [NSE - Nifty 50 TRI]
1.01% -5.23% -4.33% -11.05%
 
Scheme Benchmark [MSCI Emerging market Index]
-6.44% 2.08% -1.62% 12.41%
 
Long term Returns
2 Year 3 Year 5 Year 10 Year
13.91% 22.41% 1.11% 6.11%
 
 
-2.07% 7.60% 6.59% 11.58%
 
 
18.36% 18.26% 4.71% 5.82%
 
Cumulative Performance of Last 5 Years
 
Calendar Year Returns

Risk Analysis
 
Absolute Metrics (Single Computation - last 3 years)
Scheme Name Standard Deviation Sharpe Ratio Downside Deviation Downside Probability Sortino Ratio
PGIM India Emerging Markets Equity FoF (G) 20.50% -0.1439 16.3506% 45.6640 0.0130
 
Benchmark Relative Metrics (Single Computation - last 3 years)
Scheme Name Alpha Beta Treynor Ratio Tracking Error Information Ratio
PGIM India Emerging Markets Equity FoF (G) -3.0506% 0.5257 -0.0620 22.3272 -0.1810
 
Back to Selection